See the gallery of stimuli.
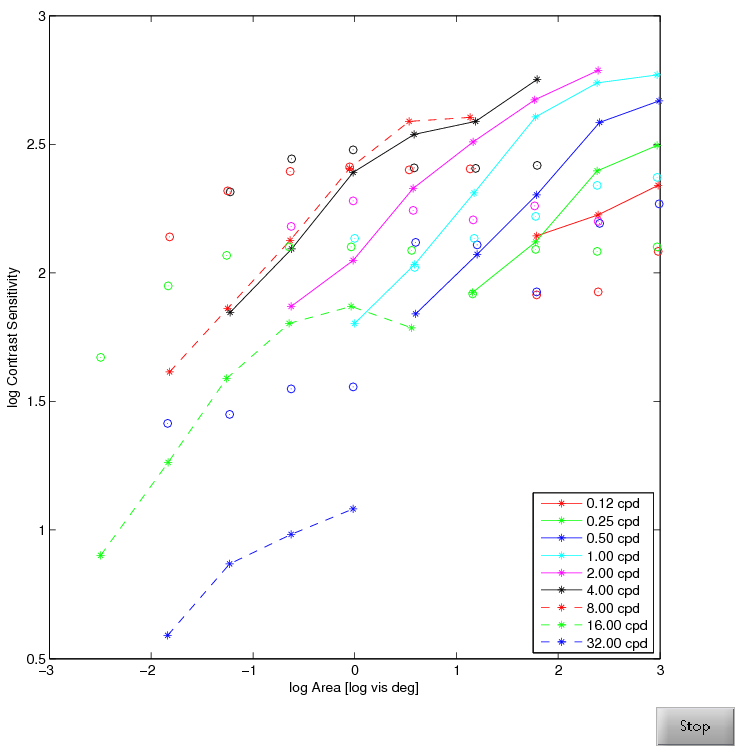
The data set decribes changes in contrast sensitivity due to the size of the grating. The data is reproduced from Figure 2, open squares (vertical gratings for OL) in the paper: Rovamo J, Luntinen O, Näsänen R. Modelling the dependence of contrast sensitivity on grating area and spatial frequency. Vision research. 1993;33(18):2773-88.
The stimuli are sine-waves bounded by a squared area on a 50 cd/m2 background.
Note that most metrics cannot reproduce the differences between sensitivities to patterns of different spatial frequency. It is not clear what is the reason for that.
This is the original Visual Difference Predictor based on corresponence with the author and the book chaper: Daly, S. "The Visible Differences Predictor: An Algorithm for the Assessment of Image Fidelity." In Digital Images and Human Vision, edited by Andrew B. Watson, 179-206. MIT Press, 1993.
The metric uses the default parameters from the paper except the masking slope, set to 0.9 for all bands, which was found from fitting the metric to the masking data sets. One optional component in the VDP is computing contrast in the cortex filtered images, which could be either global or local. This version uses global contrast.
The metric also includes an improved variation of the phase uncertainty, as described in: Lukin, A. "Improved Visible Differences Predictor Using a Complex Cortex Transform." In International Conference on Computer Graphics and Vision (GraphiCon), 2009. Phase uncertainty is not mentioned in the '93 book chapter, but is described in the patent application. The method proposed by Lukin achieves the same goals as phase uncertainty but is more elegant and efficient than the approach described in the patent.