See the gallery of stimuli.
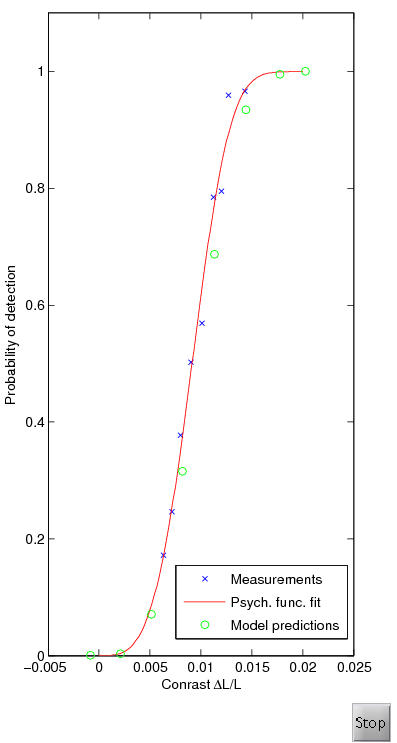
This data set contains the measusrement of the psychometric function. The function describes how the probability of detection (y-axis) is related to the physical contrast of a stimulus (x-axis). The stimulus is a 9 cpd grating.
The blue crosses on the plot represent measurements, the red continous line is the fit of the psychometric function (Eq. 17 in the HDR-VDP-2 paper), and green circles are the prediction of the visual metric.
The data was reproduced from: Nachmias J, Sansbury RV. Letter: Grating contrast: discrimination may be better than detection. Vision research. 1974;14(10):1039-42.link; Figure 2, data 9 cpd grating, observer CS, open symbols curve (detection).
This is the original Visual Difference Predictor based on corresponence with the author and the book chaper: Daly, S. "The Visible Differences Predictor: An Algorithm for the Assessment of Image Fidelity." In Digital Images and Human Vision, edited by Andrew B. Watson, 179-206. MIT Press, 1993.
The metric uses the default parameters from the paper except the masking slope, set to 0.9 for all bands, which was found from fitting the metric to the masking data sets. One optional component in the VDP is computing contrast in the cortex filtered images, which could be either global or local. This version uses global contrast.
The metric also includes an improved variation of the phase uncertainty, as described in: Lukin, A. "Improved Visible Differences Predictor Using a Complex Cortex Transform." In International Conference on Computer Graphics and Vision (GraphiCon), 2009. Phase uncertainty is not mentioned in the '93 book chapter, but is described in the patent application. The method proposed by Lukin achieves the same goals as phase uncertainty but is more elegant and efficient than the approach described in the patent.