See the gallery of stimuli.
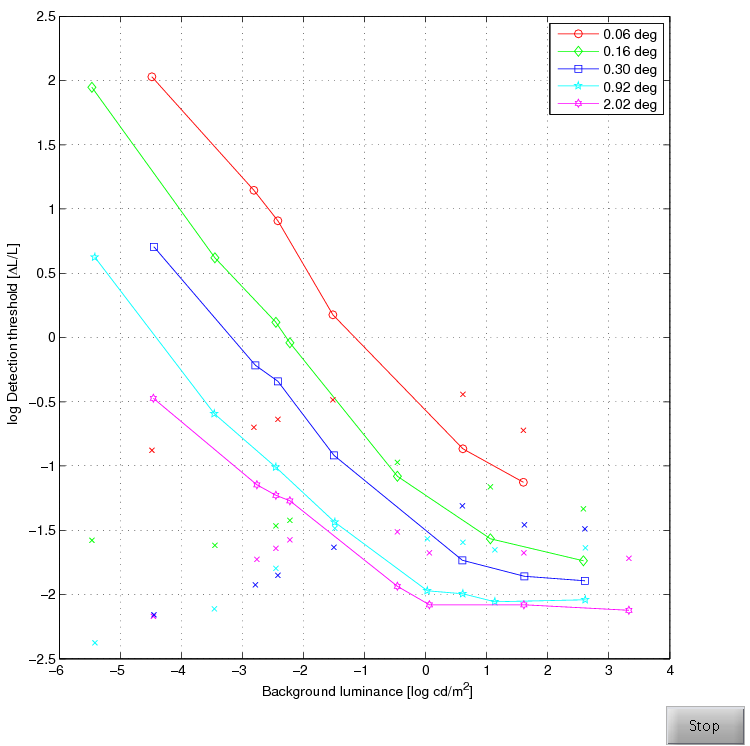
The data set decribes changes in contrast sensitivity with varying background luminance. The data is reproduced from the paper: Blackwell H.R. Contrast thresholds of the human eye. J. Opt. Soc. Am. 1946;36:624-632. The data is for Part I (increments) and Part II (decrements).
In a laboratory built for the purpose of these measurements, over 400,000 observations have been recorded and manually analyzed to determine detection thresholds for circular disks of different sizes (from 0.06 to 2 deg diameter) shown on a uniform adapting field (from 10-5 to 103.5 cd/m2).
This is the original Visual Difference Predictor based on corresponence with the author and the book chaper: Daly, S. "The Visible Differences Predictor: An Algorithm for the Assessment of Image Fidelity." In Digital Images and Human Vision, edited by Andrew B. Watson, 179-206. MIT Press, 1993.
The metric uses the default parameters from the paper except the masking slope, set to 0.9 for all bands, which was found from fitting the metric to the masking data sets. One optional component in the VDP is computing contrast in the cortex filtered images, which could be either global or local. This version uses global contrast.
The metric also includes an improved variation of the phase uncertainty, as described in: Lukin, A. "Improved Visible Differences Predictor Using a Complex Cortex Transform." In International Conference on Computer Graphics and Vision (GraphiCon), 2009. Phase uncertainty is not mentioned in the '93 book chapter, but is described in the patent application. The method proposed by Lukin achieves the same goals as phase uncertainty but is more elegant and efficient than the approach described in the patent.