See the gallery of stimuli.
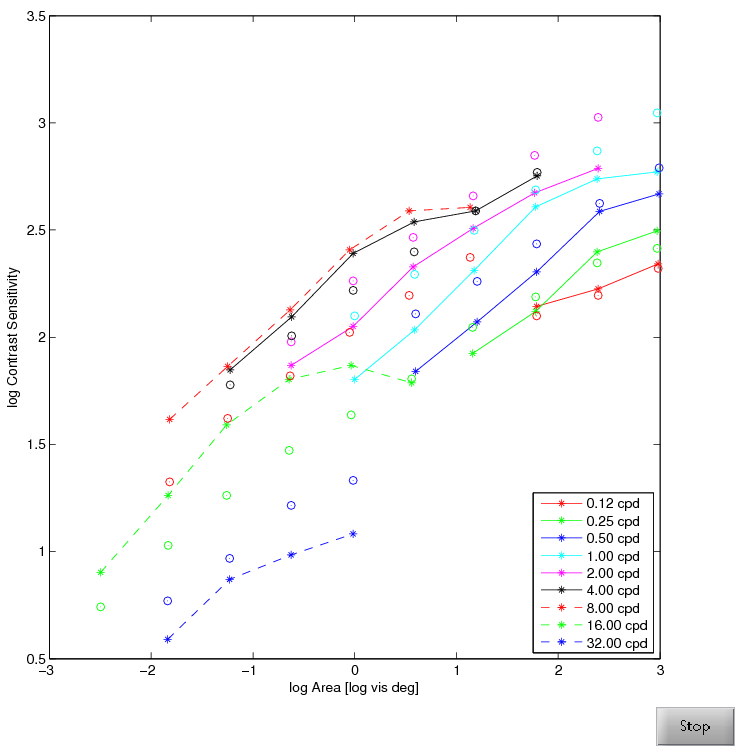
The data set decribes changes in contrast sensitivity due to the size of the grating. The data is reproduced from Figure 2, open squares (vertical gratings for OL) in the paper: Rovamo J, Luntinen O, Näsänen R. Modelling the dependence of contrast sensitivity on grating area and spatial frequency. Vision research. 1993;33(18):2773-88.
The stimuli are sine-waves bounded by a squared area on a 50 cd/m2 background.
Note that most metrics cannot reproduce the differences between sensitivities to patterns of different spatial frequency. It is not clear what is the reason for that.
This is the revision of the metric described in detail in the paper "HDR-VDP-2: A calibrated visual metric for visibility and quality predictions in all luminance conditions" (doi). It shares many similarities with VDP'93 and HDR-VDP, as it was inspired by these metrics, but the functionality is much extended and individual components are thoroughly revised. Note that the model parameters for this revision are different than the parameters included in the supplementary materials of the paper. Refer to the project web-page for the latest code and parameter values.
Revision 2.1 fixes an important bug that caused the nCSF to remain fixed below 1 cd/m^2. To extend the operational dynamic range, the CSF was measured at additional luminance level of 0.002 cd/m^2. The CSF was also measured for all observers, resulting in a more accurate CSF function fit. The predictions are improved for majority of data sets.