See the gallery of stimuli.
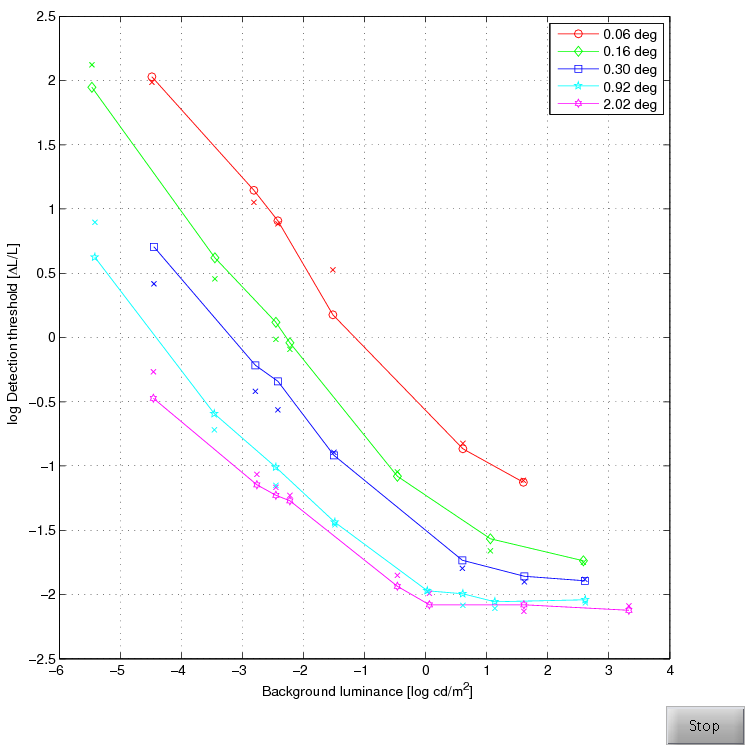
The data set decribes changes in contrast sensitivity with varying background luminance. The data is reproduced from the paper: Blackwell H.R. Contrast thresholds of the human eye. J. Opt. Soc. Am. 1946;36:624-632. The data is for Part I (increments) and Part II (decrements).
In a laboratory built for the purpose of these measurements, over 400,000 observations have been recorded and manually analyzed to determine detection thresholds for circular disks of different sizes (from 0.06 to 2 deg diameter) shown on a uniform adapting field (from 10-5 to 103.5 cd/m2).
This is the revision of the metric described in detail in the paper "HDR-VDP-2: A calibrated visual metric for visibility and quality predictions in all luminance conditions" (doi). It shares many similarities with VDP'93 and HDR-VDP, as it was inspired by these metrics, but the functionality is much extended and individual components are thoroughly revised. Note that the model parameters for this revision are different than the parameters included in the supplementary materials of the paper. Refer to the project web-page for the latest code and parameter values.
Revision 2.1 fixes an important bug that caused the nCSF to remain fixed below 1 cd/m^2. To extend the operational dynamic range, the CSF was measured at additional luminance level of 0.002 cd/m^2. The CSF was also measured for all observers, resulting in a more accurate CSF function fit. The predictions are improved for majority of data sets.