Metric fitting results
Metric "HDR-VDP-2.0"Test set "Rovamo spatial integration"
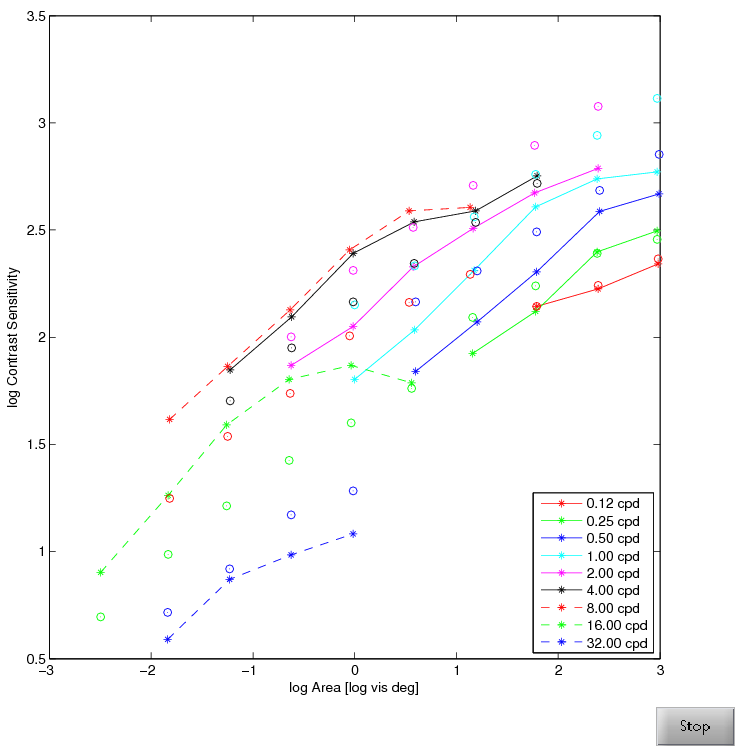
R = 4.7 dB
See the gallery of stimuli.
About the data set "Rovamo spatial integration"
Spatial integration across frequencies
The data set decribes changes in contrast sensitivity due to the
size of the grating. The data is reproduced from Figure 2, open squares
(vertical gratings for OL) in the paper: Rovamo J, Luntinen O, Näsänen
R. Modelling the dependence of contrast sensitivity on grating area
and spatial frequency. Vision research. 1993;33(18):2773-88.
The stimuli are sine-waves bounded by a squared area on a 50
cd/m2 background.
Note that most metrics cannot reproduce the differences between
sensitivities to patterns of different spatial frequency. It is not
clear what is the reason for that.
About the metric "HDR-VDP-2.0"
This is the proposed metric described in
detail in the paper "HDR-VDP-2: A calibrated visual metric for
visibility and quality predictions in all luminance conditions" (doi). It shares
many similarities with VDP'93 and HDR-VDP, as it was inspired by these
metrics, but the functionality is much extended and individual
components are thoroughly revised. The major differences are:
- The metric predicts both visibility (detection/decrimination)
and image quality (mean-opinion-score).
- The metric is based on new CSF measurements, made in the
consistent viewing conditions for a large range of luminance and
frequency.
- The new metric models L-, M-, S- and rod sensitivities and is
sensitive to different spectral characteristic of the incoming
light.
- Photoreceptor light sensitivity is modelled separately for cones
and rods, though L and M cones share the same characteristic.
- The intra-ocular light scatter function (glare) has been fitted
to the experimental data.
- The model used a steerable pyramid rather than cortex transform
to decompose image into spatially- and orientation-selective
bands. Steerable filter introduces less ringing and in general case
is computationally more efficient.
- The new model of contrast masking introduces inter-band masking
and the effect of CSF flattening.
- A simple spatial-integration formula using probability summation
is used to account for the effect of stimuli size.