Metric fitting results
Metric "HDR-VDP-2.0"Test set "Psychophysical func."
R = 0.53 dB
See the gallery of stimuli.
About the data set "Psychophysical func."
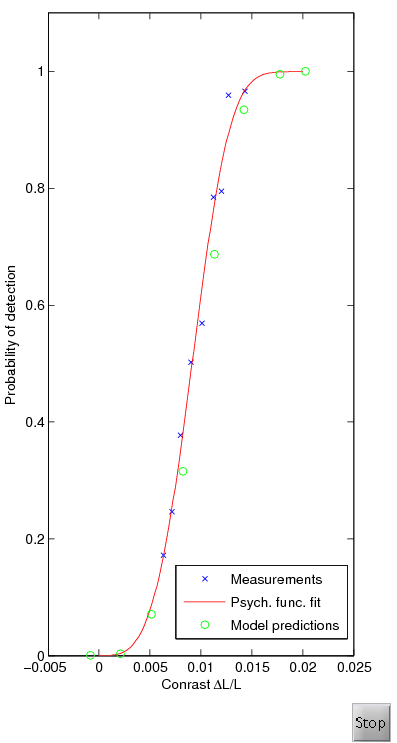
Nachmias - psychometric function
This data set contains the measusrement of the psychometric
function. The function describes how the probability of detection
(y-axis) is related to the physical contrast of a stimulus
(x-axis). The stimulus is a 9 cpd grating.
The blue crosses on the plot represent measurements, the red
continous line is the fit of the psychometric function (Eq. 17 in the
HDR-VDP-2 paper), and green circles are the prediction of the visual
metric.
The data was reproduced from: Nachmias J, Sansbury RV. Letter:
Grating contrast: discrimination may be better than detection. Vision
research. 1974;14(10):1039-42.link; Figure 2,
data 9 cpd grating, observer CS, open symbols curve (detection).
About the metric "HDR-VDP-2.0"
This is the proposed metric described in
detail in the paper "HDR-VDP-2: A calibrated visual metric for
visibility and quality predictions in all luminance conditions" (doi). It shares
many similarities with VDP'93 and HDR-VDP, as it was inspired by these
metrics, but the functionality is much extended and individual
components are thoroughly revised. The major differences are:
- The metric predicts both visibility (detection/decrimination)
and image quality (mean-opinion-score).
- The metric is based on new CSF measurements, made in the
consistent viewing conditions for a large range of luminance and
frequency.
- The new metric models L-, M-, S- and rod sensitivities and is
sensitive to different spectral characteristic of the incoming
light.
- Photoreceptor light sensitivity is modelled separately for cones
and rods, though L and M cones share the same characteristic.
- The intra-ocular light scatter function (glare) has been fitted
to the experimental data.
- The model used a steerable pyramid rather than cortex transform
to decompose image into spatially- and orientation-selective
bands. Steerable filter introduces less ringing and in general case
is computationally more efficient.
- The new model of contrast masking introduces inter-band masking
and the effect of CSF flattening.
- A simple spatial-integration formula using probability summation
is used to account for the effect of stimuli size.