See the gallery of stimuli.
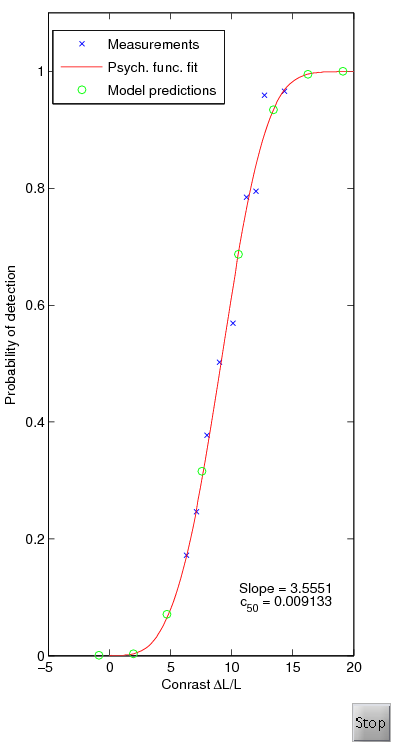
This data set contains the measusrement of the psychometric function. The function describes how the probability of detection (y-axis) is related to the physical contrast of a stimulus (x-axis). The stimulus is a 9 cpd grating.
The blue crosses on the plot represent measurements, the red continous line is the fit of the psychometric function (Eq. 17 in the HDR-VDP-2 paper), and green circles are the prediction of the visual metric.
The data was reproduced from: Nachmias J, Sansbury RV. Letter: Grating contrast: discrimination may be better than detection. Vision research. 1974;14(10):1039-42.link; Figure 2, data 9 cpd grating, observer CS, open symbols curve (detection).
This is the Visual Difference Predictor for High Dynamic Range Images, C++ implementation from http://www.mpi-inf.mpg.de/resources/hdr/vdp/index.html, version 1.7
The metric is an extension of the VDP'93 metric that can better handle high dynamic range images. HDR-VDP includes, in addition to the VDP'93 feature set, a model of glare (intra-occular light scatter), photoreceptor response (single luminance channel) and the CSF that adapts locally to the pixel luminance.
The algorithm is described in: R. Mantiuk, S. Daly, K. Myszkowski, and H.P. Seidel. "Predicting visible differences in high dynamic range images: model and its calibration." In Human Vision and Electronic Imaging, 204-214, 2005.